Make your Notion documents interactive with embeds

We’re big Notion fans at Rows - it is our central hub for all internal documentation. It’s where we update the progress in our team objectives, write notes from customer meetings, plan the product roadmap, and document our discussions and decisions.
Many of those Notion docs are reports. And inevitably those reports need context that is stored on a spreadsheet - a chart with the results of a Marketing campaign, the planned vs actual data for the company budget, or the weekly progress on the number of sign-ups.
With the new Rows embed in Notion those reports are live documents that are always synced with their spreadsheet counterparts. No more taking badly cropped screenshots of a spreadsheets chart or copy-pasting from the spreadsheet to Notion. When the data changes, the doc changes with it.
Inspired by this new way of documenting our work, we included 4 Notion templates so you too can upgrade your docs with interactive spreadsheets that make your (life’s) work a bit more…lively.
The best part? You can import your Notion databases directly to Rows using the new Notion integration so that you can add beautiful charts to your Notion reports, seamlessly connected to a Notion database.
Paid marketing campaign report
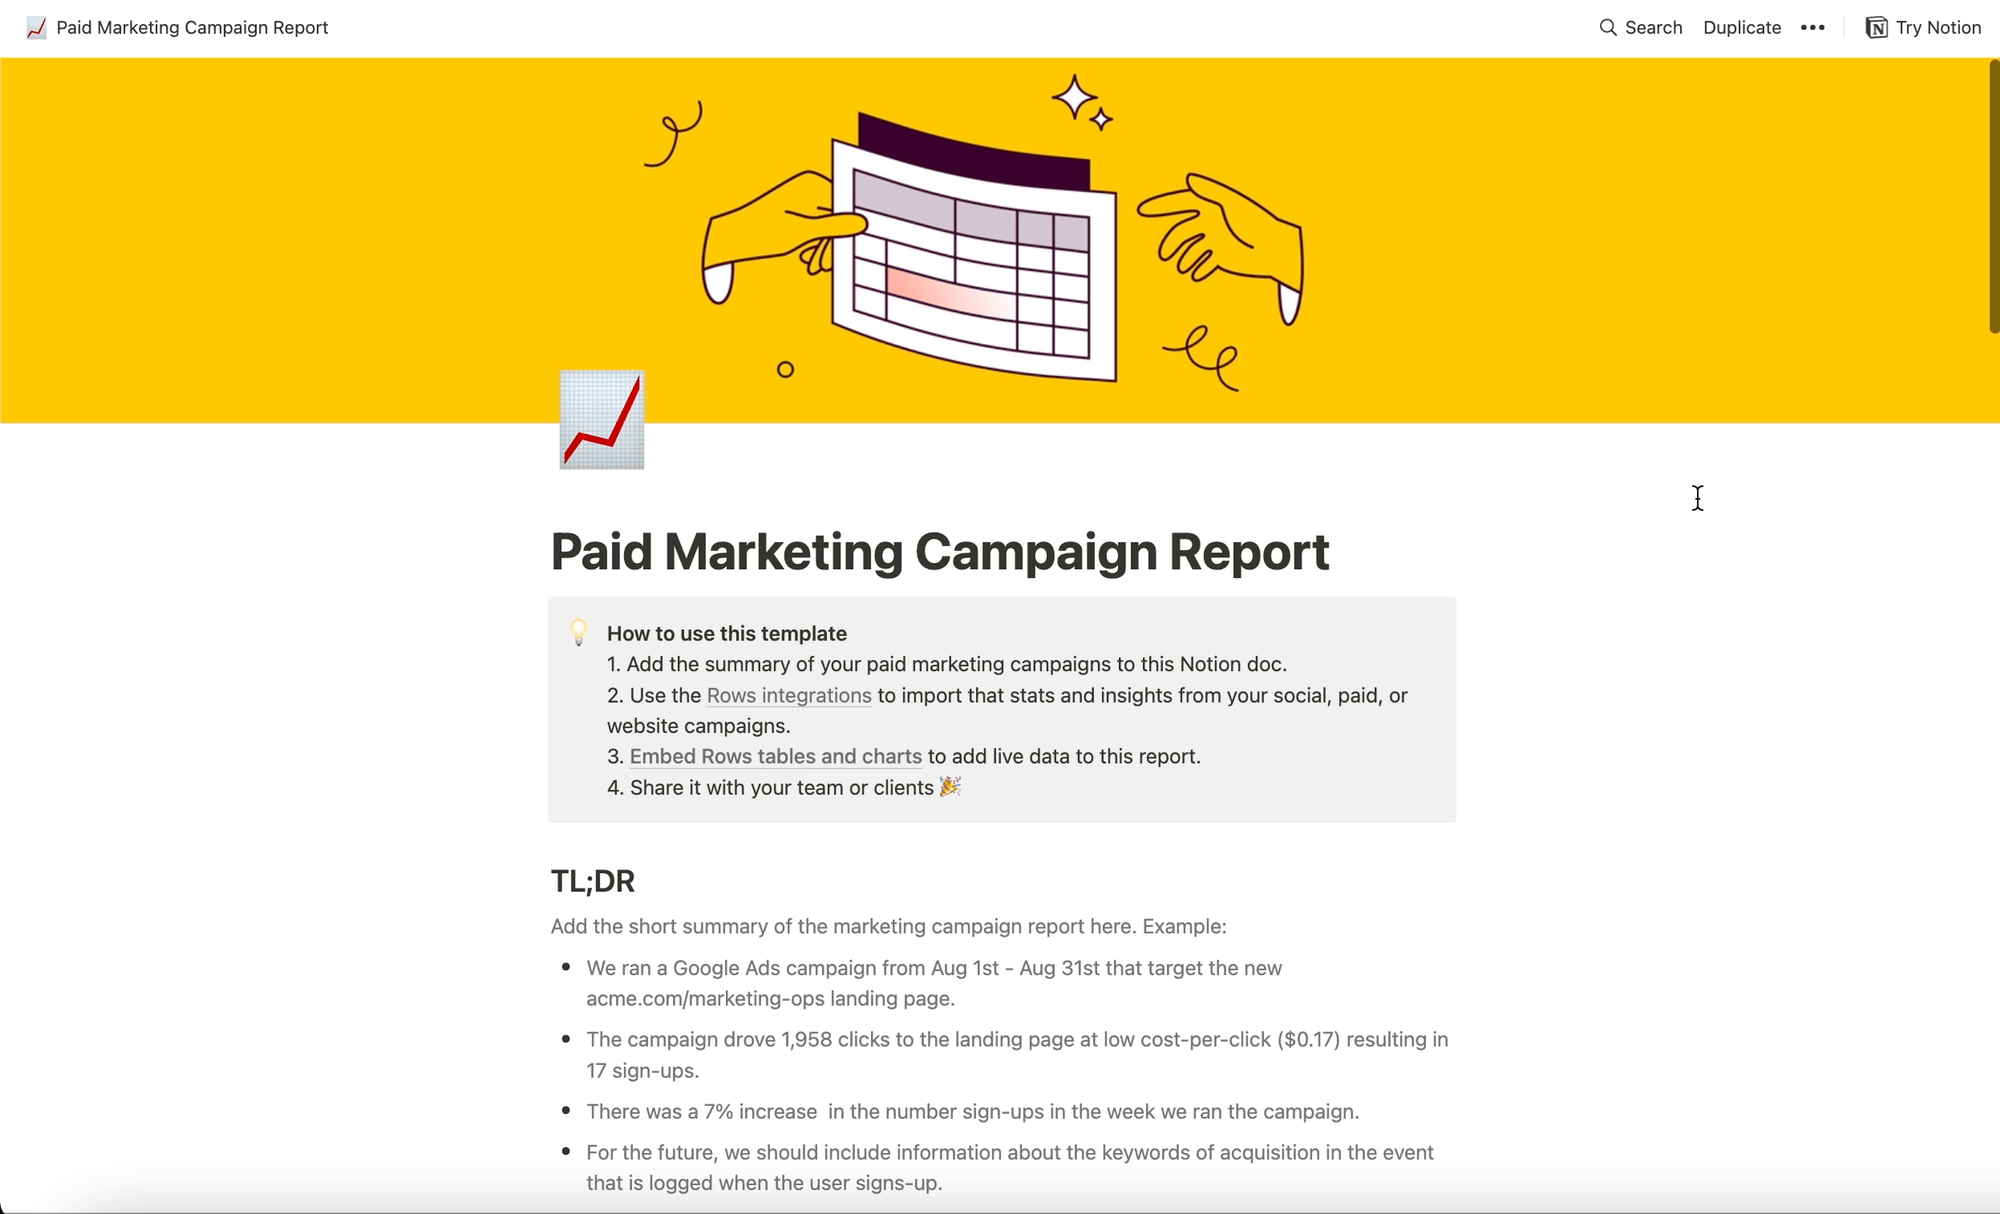 The Paid Marketing Report template
Whenever we run a paid marketing campaign - be it on social, search, or brand - the end result of it is a document with the summary of the campaign. Writing it marks the final step before closing the project, and it acts as the artifact to record our learnings, and share them with the team. It follows a 5 part-structure:
TL;DR: The bite-sized summary of the campaign, results and learnings. The “report for people in a hurry” edition.
Overview: A description of the goal of the campaign, channels used, budget and other context about it.
Results: The charts and relevant visual summary results of the campaign, embedded from the spreadsheet that sources the analysis.
Learnings: A list of the most relevant learnings and action points from the campaign.
Deep Dive: Typically embeds of additional charts, tables of the spreadsheet report and a link to the full analysis on the spreadsheet.
Adding the live connection to the spreadsheet makes it easy for anyone to both see the results of the campaign and dig below the surface without having to nerd out on the full spreadsheet. And using our built-in integrations with Facebook Ads, Google Ads, Linkedin Ads and many others you too can import the stats from your paid campaigns instantly into a Rows spreadsheet, and even schedule it to refresh everyday.
Your system will likely be different, but you’d like a starting point, we included a copy of our report structure in this Notion template.
Duplicate our Paid Marketing Campaign Report template →
Website traffic overview report
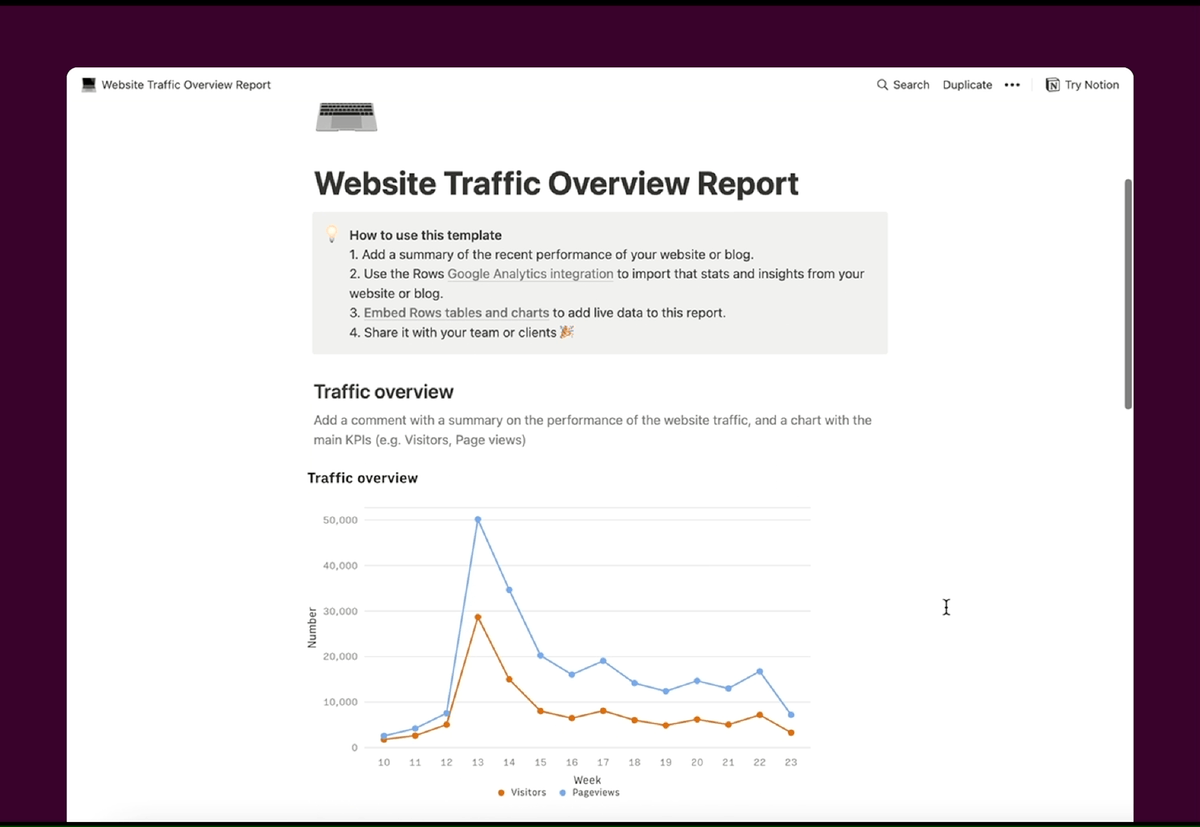 The Website Traffic Report template
Our website is a big part of our marketing strategy. For most visitors, it is their first impression of Rows and a deciding factor in piquing their curiosity to try out our spreadsheet.
This website traffic overview report gives our Marketing team a birds-eye view of the performance of the website traffic, how well we’re converting visitors to sign-ups, and how much traffic we’re seeing from different referral sources. It is also the starting point to deeper analysis on specific bottlenecks in the experience - e.g. a deep diving on high bounce rate - or on pleasant surprises - a spike in referring traffic from a new source.
Using the Rows built-in integrations with Google Analytics allows us to build the reports in a few clicks without ever leaving the spreadsheet.
Duplicate our Website Traffic Overview Report template →
Growth experiments report
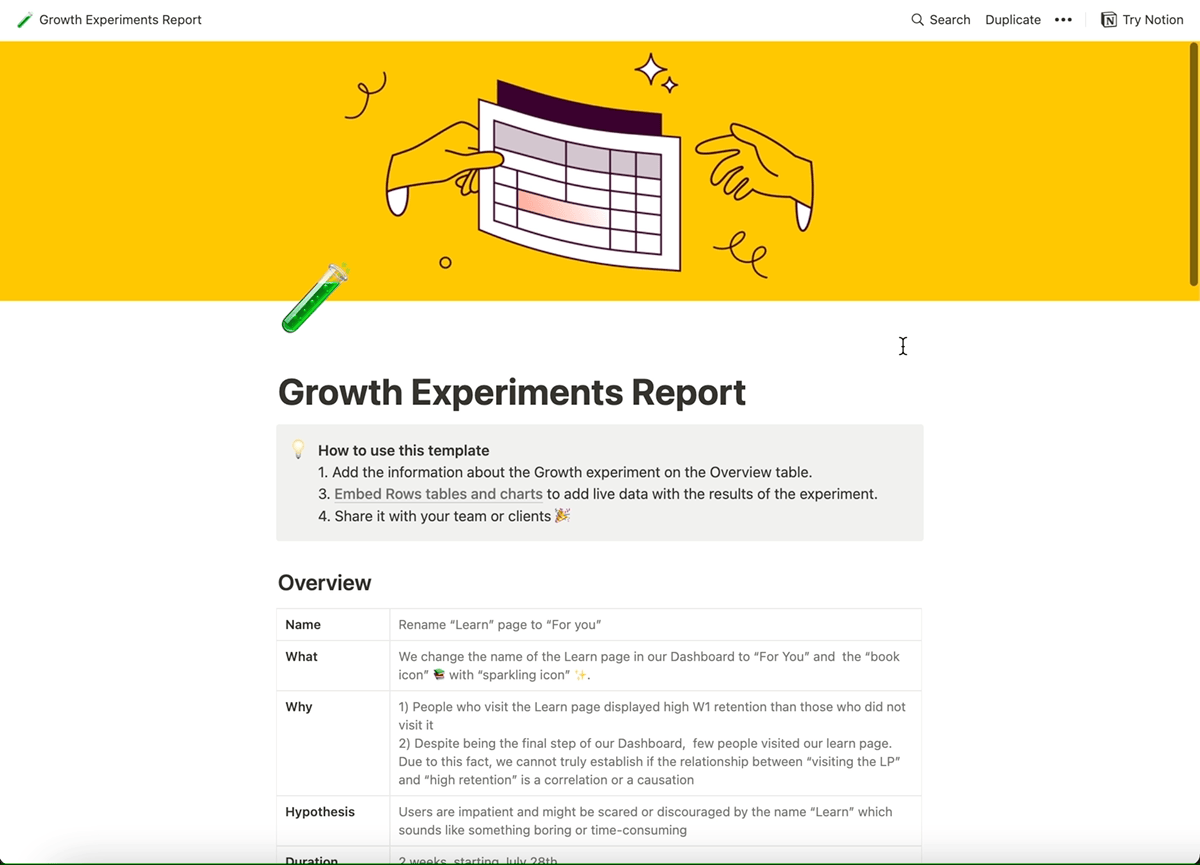 The Growth Experiments Report template
Designing, building and evaluating experiments is at the heart of what our Growth team does everyday. And almost as important as doing the experiment is summarizing its results, consolidating what we’ve learned, and deciding what to do next.
That’s where the Growth experiment report comes in. We use this template to summarize every growth experiment we run, and record what we’ve tried in the past, what worked, didn’t work, and what we learned from it.
The report is a 2-parter:
First, the Overview part where we outline the what, why, duration, hypothesis that drives the experiment, KPIs to assess impact and its potential outcomes. This section is written before the experiment is deployed.
Then, the Results part, where we compare the KPIs before and after the experiment - synced with the spreadsheet with the full analysis - and result of the experiment. Finally, we add the SQL queries used to pull the data used for the analysis, in case we want to repeat it anytime in the future.
Pair it with our Growth experiments tracker template for an overview of your Growth experiments backlog and roadmap.
Duplicate our Growth Experiments Report template →
Weekly team sync notes
 The Weekly team sync notes template
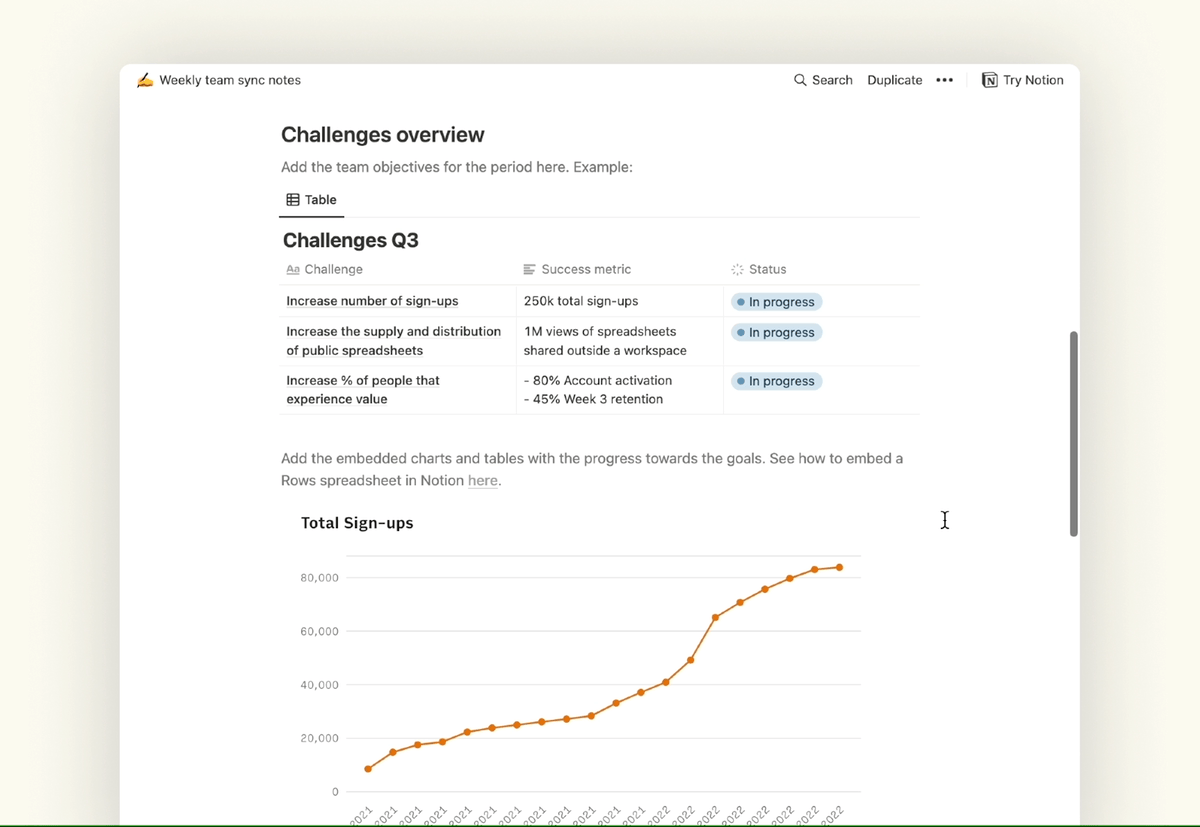
Every week, every team. That’s the motto for every team’s routine progress updates. Every team has a set of quarter challenges to solve, and every week each team documents on Notion their progress towards solving those challenges and shares them in a public Slack channel to the whole Rows team.
For some teams (our Marketing and Growth teams are prime examples) each challenge is matched with a target KPI such as user retention, activation rate, number of views of Community spreadsheets or whatever else we’re tackling in that quarter.
We use this Weekly team sync notes template and embed in it a summary table and charts with the live view of our progress towards those KPIs. This increases gives our team a pulse of where we are vs our goals, increases accountability, and adds transparency to the rest of the organization.
Take a look at the template and duplicate it to your Notion workspace.
Duplicate our Weekly team sync notes template →
Better data for better docs
By the end of this post I hope you’ve seen how embedding the right data in your Notion docs can help your team build better documents and run more effective meetings. All it takes is a great spreadsheet to pair with your Notion workspace. And Rows got you covered on that.
If you’re curious about what we’re building, give Rows a try and sign up for free.